RESEARCH ARTICLE |
https://doi.org/10.5005/jp-journals-10005-2140 |
Comparative Evaluation of Esthetic Improvement of Resin Infiltration (RI), In-office Bleaching (B), Enamel Microabrasion (M) and Resin Infiltration with Double Application of Infiltrant (2RI) on Non-pitted Fluorosis Stains: A Randomized Six-month Interventional Study
1,2Pedodontics and Preventive Dentistry, Post Graduate Institute of Dental Sciences, Rohtak, Haryana, India
3Public Health Dentistry, Postgraduate Institute of Dental Sciences, Rohtak, Haryana, India
Corresponding Author: Ishika Garg, Pedodontics and Preventive Dentistry, Post Graduate Institute of Dental Sciences, Rohtak, Haryana, India, Phone: +91 9953924493, e-mail: gargishika1993@gmail.com
ABSTRACT
Background: Newer minimally invasive treatment options for improvement in appearance of dental fluorosis stains are gaining popularity in recent years.
Objective: To evaluate and compare the clinical success in esthetic improvement of resin infiltration, in-office bleaching with 35% hydrogen peroxide, enamel microabrasion, and resin infiltration with double infiltrant application on nonpitted fluorosis stains.
Materials and Methods: Seventy two patients aged between 6 and 12 years with nonpitted dental fluorosis stains on the upper anterior teeth were randomly selected and divided into four interventional groups: group 1- resin infiltration (RI), group 2- in-office bleaching using 35% hydrogen peroxide (B), group 3- enamel microabrasion (M), and group 4- resin infiltration with double infiltrant application (2RI). In each group, standardized photographs were taken preoperatively, immediate postoperatively and after 1, 3, and 6 months time interval postoperatively to assess the esthetic improvement (EI) and changes in white/brown surface opacities/stains (SC) using a Visual Assessment Scale (VAS).
Results: RI and 2RI showed statistically significant results (p ≤0.05) followed by microabrasion and bleaching, for both the evaluation criteria (EI and SC) at all the follow-up intervals.
Conclusion: Resin infiltration is a promising procedure that demonstrated remarkable clinical success for improvement in esthetics of nonpitted fluorosis stains with stable long-term positive outcome.
How to cite this article: Garg I, Kumar A, Kumar A. Comparative Evaluation of Esthetic Improvement of Resin Infiltration (RI) In-office Bleaching (B) Enamel Microabrasion (M) and Resin Infiltration with Double Application of Infiltrant (2RI) on Non-pitted Fluorosis Stains: A Randomized Six-month Interventional Study. Int J Clin Pediatr Dent 2022;15(1):20-34.
Source of support: Nil
Conflict of interest: None
Keywords: In-office bleaching, Microabrasion, Non-pitted fluorosis stains, Resin infiltration
INTRODUCTION
The role of fluorides in the prevention of dental caries is well documented. However, excessive intake of fluoride beyond the optimal limits can result in dental fluorosis. The severity of fluorosis depends on the dosage and duration of ingestion of fluoride during periods of tooth formation. Nonpitted dental fluorosis is characterized by tooth discoloration ranging from white opacities to yellow or dark brown stains.1
A number of treatment modalities have been recommended for the esthetic management of dental fluorosis which include macro-abrasion, composite resin restorations, veneers, or full crowns.2 However, the extensiveness of these treatment procedures, the reduction in amount of tooth structure for esthetic correction and the possible sequelae of tooth sensitivity are the drawbacks associated with such conventional approaches. In the recent past, newer noninvasive or minimally invasive treatment approaches such as resin infiltration, resin infiltration with double infiltrant application, in-office bleaching, and microabrasion have been advocated for the management of fluorosis stains. The major benefits of these treatment techniques include no or minimal tooth reduction, minimal tooth sensitivity or pain, simplicity and ease of application, no need for any special maintenance precautions and favorable esthetic results along with increased patient acceptance and compliance.3
The present randomized interventional study was conducted to evaluate and compare the esthetic improvement (EI) and changes in white/brown surface opacities/stains (SC) in mild to moderate nonpitted fluorosis stains when treated with resin infiltration (RI), in-office bleaching (B), enamel microabrasion (M), and resin infiltration with double infiltrant application (2RI).
The follow-up was done at 1, 3, and 6 months time period for evaluating sustainability and clinical success.
MATERIALS AND METHODS
The present study was conducted in the Department of Pedodontics and Preventive Dentistry, Post Graduate Institute of Dental Sciences (PGIDS), Rohtak, Haryana, India for a time span of 1 year from March 2019 to March 2020. A total of 72 healthy cooperative children aged 6-12 years with unesthetic appearance (white or brown discoloration, stains and /or opacities) of upper anterior teeth due to nonpitted fluorosis seeking dental treatment were selected for the study. Written informed consent was taken from each participant’s parents/guardian for participation in the study. Children with non-fluoride opacities and pitted fluorosis, history of known dental material allergy, fractured teeth, past history of treatment of dental fluorosis, systemic illness (mental retardation/ severe psychotic disorders), severe sensory and/or motor impairment, and those unwilling to participate were excluded from the study.
A study questionnaire consisting of all the required information in a brief and systematic manner was provided for patient evaluation. The questionnaire consisted of baseline information relating to patient, past medical and dental history, dental hard and soft tissue examination, treatment groups; fluorosis index, follow-up criteria of study participants, and inferences in explicated manner.
The “fluoride” and “non-fluoride” opacities were differentiated following Russell’s criteria.4 The classification of severity of dental fluorosis was done as per Dean’s Fluorosis Index (DFI)— Modified Criteria (1942).5 The participants with DFI score of 0.5,1,2,3 that is nonpitted fluorosis were included in the study. Since fluorosis generally affects more than one tooth in the dentition, in such cases the anterior tooth most severely affected due to fluorosis and presenting maximum DFI score was chosen for the study.
Sample Size
As per 80 % power analysis, 14 patients were needed in each group with expected mean difference of 1.3 and accepted alpha error of 5 %. For estimated drop out, 4 subjects per samples were added for each group (25% drop outs). Henceforth, a total of 18 subjects per group were included under study.
Randomization
Randomization was done by generating a random sequence generation table. The allocation concealment was framed by an independent person before commencing the study. The participating children were randomly allocated in four different groups by independent personnel in accordance with the sequence generation table.
Blinding/Masking
The study was single blinded. The individual participant did not know their categorization in various treatment groups. Furthermore, to ensure blinding of the outcome evaluators, they were not informed about the treatment group of the participant. However, the operator was in full possession of the facts regarding subject allotment to study groups.
Intervention
The 72 study participants were divided into four groups based upon the treatment procedure used for nonpitted fluorosis. The groups were:
Group 1: Intervention with resin infiltration (RI).
Group 2: Intervention with in-office bleaching using 35% hydrogen peroxide (B).
Group 3: Intervention with enamel microabrasion (M).
Group 4: Intervention with resin infiltration with double infiltrant application (2RI).
Prior to the beginning of treatment procedure in each group, all the participants underwent supervised tooth brushing. Subsequently, a standardized preoperative photograph was taken. The recommended clinical procedure was carried out as per manufacturer’s instructions for each intervention in a single visit.
Clinical Procedure
Group 1: Resin Infiltration
The procedure of the first arm of the study was carried out using resin infiltration kit (Fig. 1A). Rubber dam was placed obtain a clean working field free of saliva (Fig. 1B). As the first step, 15% HCl gel was applied for 2 minutes using the special applicator tip provided in the kit and stirred with a microbrush to achieve a uniform “etchy” pattern (Fig. 1C). Thereafter, the etching gel was rinsed away with water for 30 seconds (Fig. 1D). In the second step, application of 99% ethanol was done to desiccate the lesion body and remove the water retained in the microporosity of enamel lesion. (Fig. 2A). The tooth surface was then air dried. In the last step, low viscosity resin infiltrant was applied and allowed to rest for 3 minutes on the tooth surface to enable it to penetrate deeply into the lesion (Fig. 2B). After 3 minutes, the excess resin on the tooth surface was removed with cotton and light cured for 40 seconds (Fig. 2C). Moreover, a second layer of infiltrant was applied (Fig. 2D) and cured for an additional 1 minute (Fig. 2E). This was followed by polishing the enamel surface (Fig. 2F).
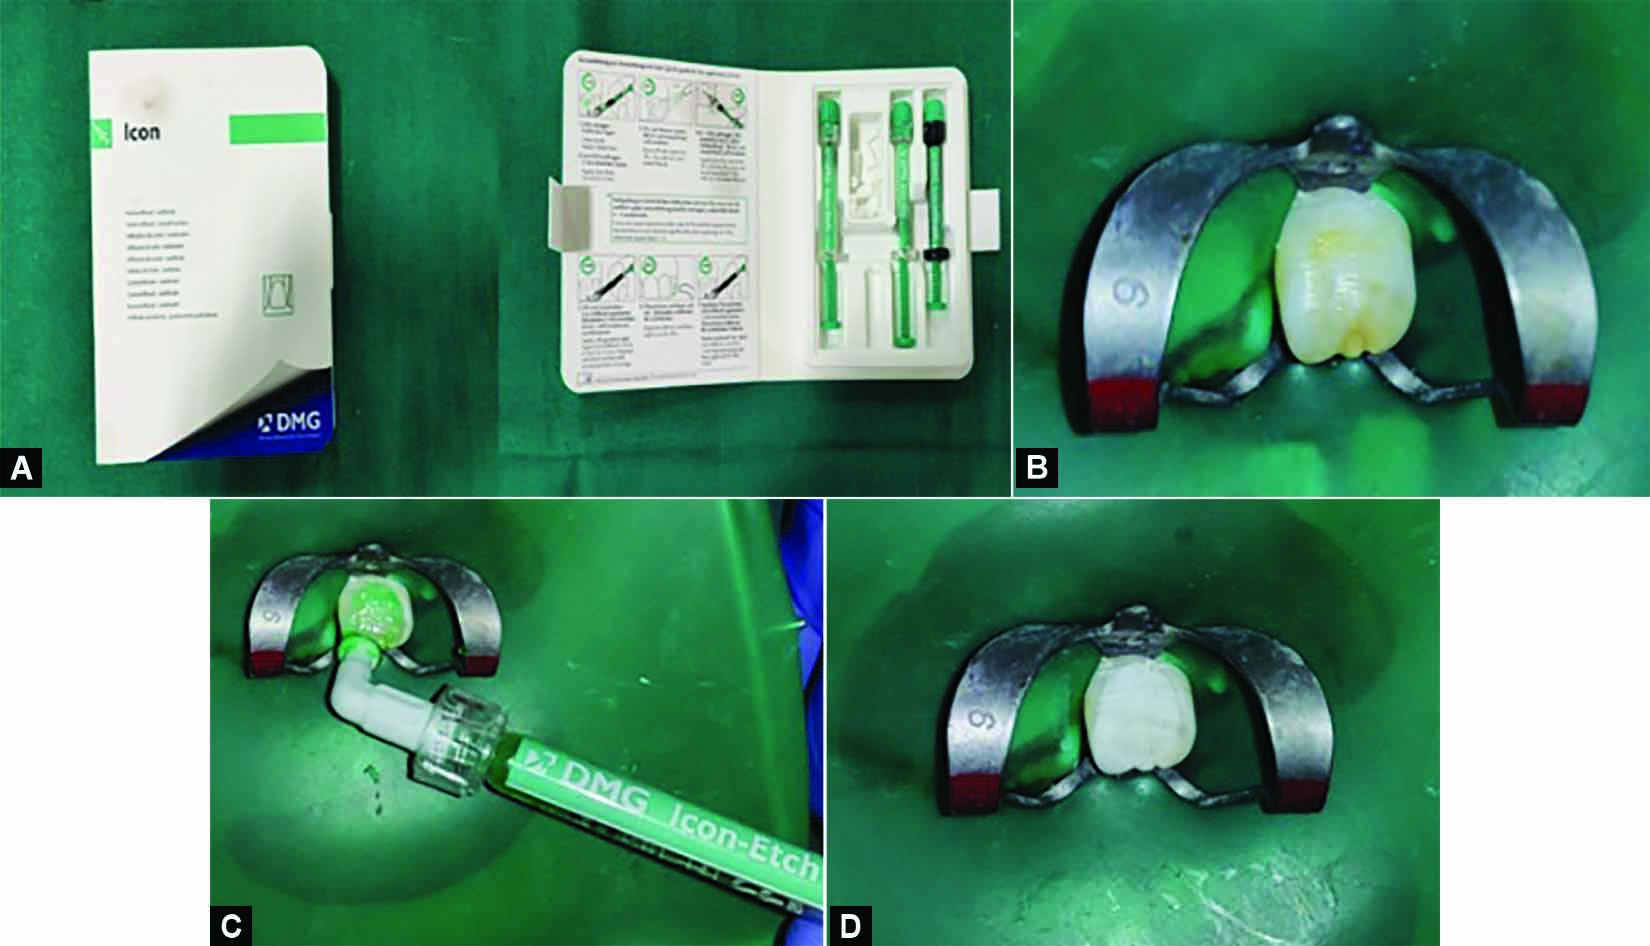
Figs 1A to D: (A) Resin infiltration kit consisting of Icon etchant (15% hydrochloric acid), Icon dry (99% ethanol), and resin infiltrant (methacrylate based resin matrix, initiators, and additives). (B) Placement of rubber dam for isolation of fluorosed tooth with Dean’s Fluorosis Index score 2. (C) Application of 15% hydrochloric acid gel (icon-etch) using special tip applicator microbrush for 120 seconds. (D) After rinsing the tooth surface with water and air drying.

Figs 2A to F: (A) Dehydration with 99% ethanol (Icon dry) for 30 seconds and air drying. (B) Application of low viscosity resin infiltrant (Icon infiltrate) for 3 minutes. (C) Light cure polymerization of resin infiltrant for 40 seconds. (D) and (E) Second layer of resin infiltrant application for 1 minute followed by light cure polymerization for 40 seconds. (F) Postoperative polishing of the enamel surface.
Group 2: In-office Bleaching with 35% Hydrogen Peroxide
In the second arm of the study, the procedure was accomplished using the bleaching kit, supplied as powder-liquid system with 35% hydrogen peroxide as functioning constituent (Fig. 4A). The treatment was executed in accordance to manufacturer’s direction. Vaseline was applied to exposed lip surfaces to protect against accidental hydrogen peroxide injuries. The selected tooth was isolated by applying rubber dam thereby providing a clear and dry field and conserve gingival tissues (Fig. 4B). The powder and liquid were blended to obtain a gel consistency (Fig. 4C). Thereafter, a thick gel layer was applied onto the labial surface of the tooth with an applicator tip and left to rest for 8 minutes (Fig. 4D). The gel was rinsed away thoroughly from the tooth surface using water and high quality suction (Fig. 4E). To enhance the tooth resistance to demineralization after effect of bleaching agent, the ACP-CPP application in the form of tooth mousse was fulfilled (Fig. 5).

Figs 3A to E: Follow-up of the study participant after resin infiltration procedure in tooth 21. (A) Preoperative view in respect to 21. (B) Immediate postoperative view. (C) One month follow-up view. (D) Three months follow-up view. (E) Six months follow-up view.

Figs 4A to F: (A) In-office bleaching kit (SDI Pola Office) with 35% hydrogen peroxide consisting of two 0.3 gram pola office powder pots, two 2 mL pola office syringes, one 1 gm gingival barrier, syringe and accessories along with 10% calcium phosphopeptide-amorphous calcium phosphate (CPP-ACP). (B) Application of rubber dam for isolation of fluorosed tooth with Dean’s fluorosis index score 3. (C) In-office bleaching gel-35% hydrogen peroxide (pola office gel) in pot. The powder and liquid are blended to obtain gel consistency and stored in pot. (D) Application of a consistent and thick layer of pola office gel over the labial surface of tooth using special applicator tip and left over for 8 minutes. (E) After thorough wash-off with water and air drying the tooth surface

Figs 5A and B: (A) Application of GC tooth mousse for 4 minutes. (B) Postoperative view.
Group 3: Enamel Microabrasion
In the third arm, enamel microabrasion was done as the interventional procedure (Fig. 7A). During this procedure, the protection of both the patient and professional was given special emphasis by providing protective goggles and individual protective equipment (Figs. 7B and C ). The selected tooth was isolated with rubber dam (Fig. 8A). This was followed by the application and rubbing of a small amount of microabrasion material containing 6.6% hydrochloric acid and silica carbide on the tooth surface using a low speed rubber cup for 10 seconds (Figs. 8B and C ). Thereafter, the material was washed away with water from the surface of the tooth (Fig. 8D). At the end of treatment procedure, the tooth was polished using ACP-CPP creme (tooth mousse) with the purpose of reducing postoperative sensitivity and promoting remineralization (Figs 8E and F).

Figs 6A to E: Follow-up of the study participant after in-office bleaching procedure in tooth 21. (A) Preoperative view in respect to 21. (B) Immediate postoperative view. (C) One month follow-up view. (D) Three months follow-up view. (E) Six months follow-up view.

Figs 7A to C: (A) Microabrasion kit consisting of 6.6% hydrochloric acid, 20 to 160 micrometers sized silicon carbide microparticles and opal cups bristle along with contra-angle handpiece and 10% calcium phosphopeptide-amorphous calcium phosphate (CPP-ACP). (B) Operator and patient with protective eye-wear specifically used in microabrasion procedure. (C) Showing the patient wearing protective eye glasses required specifically for microabrasion procedure

Figs 8A to F: (A) Rubber dam for isolation of fluorosed tooth with Dean’s fluorosis index score 3. (B) Application of a small amount of microabrasion paste onto the tooth surface. (C) Microabrasion performed using a rubber cup attached to a low-speed contra-angle handpiece. (D) After rinsing with water and air drying. (E) Application of GC tooth mousse for 4 minutes. (F) Postoperative view.
Group 4: Resin Infiltration with Double Infiltrant Application
In Group 4, the intended tooth was treated in the similar manner as in Group I (Fig. 10A to F). Moreover, an additional layer of infiltrant was applied for 3 minutes (Fig. 11A to F).

Figs 9A to E: Follow-up of the study participant after microabrasion procedure in tooth 11. (A) Preoperative view in respect to 11. (B) Immediate postoperative view. (C) One month follow-up view. (D) Three months follow-up view. (E) Six months follow-up view.

Figs 10 A to F: (A) Placement of rubber dam for isolation of fluorosed tooth with Dean’s Fluorosis Index score 2. (B) Application of 15% hydrochloric acid gel (icon-etch) using special tip applicator microbrush for 120 seconds. (C) After rinsing the tooth surface with water and air drying. (D) Dehydration with 99% ethanol (icon dry) for 30 seconds and air drying. (E) Application of low viscosity resin infiltrant (icon infiltrate) for 3 minutes. (F) Light cure polymerization of resin infiltrant for 40 seconds.

Figs 11A to F: (A) and (B) Second layer of resin infiltrant application for 1 minute followed by light cure polymerization for 40 seconds. (C) and (D) Additional layer of resin infiltrant application for 1 minute followed by light cure polymerization for 40 seconds. (E) Polishing of the tooth surface with pumice. (F) Postoperative view.
Follow-up of the Study Participants
In each group, preoperative (Figs. 3A,6A,9A,and 12A), immediate postoperative (Figs 3B, 6B, 9B, and 12B) and after 1 month (Figs 3C, 6C, 9C, and 12C), 3 months (Figs 3D, 6D, 9D, and 12D), and 6 months (Figs 3E, 6E, 9E, and 12E) follow-up standardized photographs were taken. All photographs were stored in a computer and evaluated later for esthetic improvement (EI) and changes in white/brown surface opacities/stains (SC) by two independent observers (Table 1). Both EC and SC were evaluated using a Visual Assessment Scale (VAS) on a score ranging from 1 to 7 (Table 2).
| Assessment of EI and SC as per VAS | Immediate Postoperative | 1 month postoperative | 3 months postoperative | 6 months postoperative |
|---|---|---|---|---|
| Esthetic improvement (EI) | ||||
| Improvement in white/brownish opacitis/Stains (SC) |
| Improvement in esthetics (EI) | |||||
| No improvement | Slight | Moderate | Exceptional improvement | ||
| 1 | 2 | 3 | 4 5 | 6 | 7 |
| Improvement in brown stains/ change in white opacities (SC) | |||||
| No improvement | Slight | Moderate | Exceptional improvement | ||
| 1 | 2 | 3 | 4 5 | 6 | 7 |

Figs 12A to E: Follow-up of the study participant after double resin infiltration procedure in tooth 21. (A) Preoperative view in respect to 21. (B) Immediate postoperative view. (C) One month follow-up view. (D) Three months follow-up view. (E) Six months follow-up view.
Statistical Analysis
The data collected for each group was entered in Microsoft Office Excel Sheet to prepare a master chart analyzed statistically using Statistical package for social sciences (SPSS v 21.0, IBM). Intergroup comparison ( > 2 groups) was done using one way ANOVA test for both the parameters that i., EI and SC. Intragroup comparison was done using repeated measures ANOVA (for ≥2 observations) followed by post hoc test. Comparison of frequencies of categories of variables with groups was done using Chi-square test. For all the statistical tests, p < 0.05 was considered to be statistically significant.
RESULTS
A total of 72 subjects age ranged from 6 to 12 years participated in the study. The mean age ± S.D. of the study subjects was 11.36 ± 1.15 years with minimum age of the patient 8 years and maximum age 12 years (Table 3).
| Study subjects (N) | Minimum | Maximum | Mean±Std. deviation (S.D.) | |
|---|---|---|---|---|
| Age | 72 | 8 | 12 | 11.36±1.15 |
Table 4 shows number of drop outs in all the groups at different follow-up intervals. At 6 months follow-up-3 subjects dropped out in group 1 (RI), 4 subjects dropped out in group 2 (B), 4 subjects dropped out in group 3 (M), and 4 subjects dropped out in group 4 (2RI). Thus, the total number of study subjects examined at final follow-up was 57. Fig. 1 shows number of study subjects at follow-up intervals in all the groups.
| Time interval | Groups | Study subjects | No. of dropouts |
|---|---|---|---|
| Immediate | 1 (RI) | 18 | - |
| 2 (B) | 18 | - | |
| 3 (M) | 18 | - | |
| 4 (2RI) | 18 | - | |
| Total | 72 | ||
| 1 Month | 1 (RI) | 16 | 2 |
| 2 (B) | 14 | 4 | |
| 3 (M) | 16 | 2 | |
| 4 (2RI) | 15 | 3 | |
| Total | 61 | 11 | |
| 3 Months | 1 (RI) | 15 | 3 |
| 2 (B) | 14 | 4 | |
| 3 (M) | 14 | 4 | |
| 4 (2RI) | 14 | 4 | |
| Total | 57 | 15 | |
| 6 Months | 1 (RI) | 15 | 3 |
| 2 (B) | 14 | 4 | |
| 3 (M) | 14 | 4 | |
| 4 (2RI) | 14 | 4 | |
| Total | 57 | 15 |

Fig. 1: Showing number of study subjects at follow-up intervals in all the groups.
Table 6 shows that there was a statistically highly significant difference (p < 0.01) seen for the VAS score values for SC between the groups for
-
Immediate with highest values in group 4 (2RI) followed by group 1 (RI), group 3 (M) and least in group 2 (B) (p = 0.007).
-
At 1 month follow-up with highest values in group 4 (2RI) followed by group 1 (RI), group 3 (M) and least in group 2 (B) (p = 0.001).
-
At 3 months follow-up with highest values in group 4 (2RI) followed by group 1 (RI), group 3 (M) and least in group 2 (B) (p = 0.000).
-
At 6 months follow-up with highest values in group 4 (2RI) followed by group 1 (RI), group 3 (M) and least in group 2 (B) (p = 0.000).
Table 7 shows that there was a statistically significant (p < 0.05) / highly significant difference (p < 0.01) seen for the VAS score values for EI between the groups
-
Immediate between the groups 2 vs 3 (p = 0.019) and 2 vs 4 (p = 0.009).
-
At 1 month follow-up between the groups 1 vs 2 (p = 0.001), 2 vs 3 (p = 0.006) and 2 vs 4 (p = 0.000).
-
At 3 months follow-up between the groups 1 vs 2 (p = 0.000), 2 vs 3 (p = 0.000) and 2 vs 4 (p = 0.000).
-
At 6 months follow-up between the groups 1 vs 2 (p = 0.000), 2 vs 3 (p = 0.001) and 2 vs 4 (p = 0.000).
The results showed that there was a statistically highly significant difference (p < 0.01) seen for the VAS score values for both esthetic improvement (EI) (Table 5, Fig. 2) and changes in white/brown/opacities/stains (SC) (Table 6, Fig. 3) between the groups at all the follow-up intervals with highest values in group 4 (2RI) followed by group 1 (RI), group 3 (M), and least in group 2 (B) for both the evaluation parameters EI and SC.
| Groups | Study subjects(N) | Mean score(EI) | Std. deviation | p value of one way ANOVA |
|---|---|---|---|---|
| Immediate 1 (RI) | 18 | 3.61 | 0.698 | 0.006 |
| 2 (B) | 18 | 3.06 | 0.639 | |
| 3 (M) | 18 | 3.72 | 0.575 | |
| 4 (2RI) | 18 | 3.78 | 0.732 | |
| Total | 72 | 3.54 | 0.711 | |
| 1 Month 1 (RI) | 16 | 4.31 | 0.793 | 0.000 |
| 2 (B) | 14 | 3.21 | 0.802 | |
| 3 (M) | 16 | 4.19 | 0.655 | |
| 4 (2RI) | 15 | 4.53 | 0.834 | |
| Total | 61 | 4.08 | 0.900 | |
| 3 Months 1 (RI) | 15 | 4.93 | 0.799 | 0.000 |
| 2 (B) | 14 | 3.43 | 0.852 | |
| 3 (M) | 14 | 4.64 | 0.497 | |
| 4 (2RI) | 14 | 4.93 | 0.730 | |
| Total | 57 | 4.49 | 0.947 | |
| 6 Months 1 (RI) | 15 | 5.40 | 0.632 | 0.000 |
| 2 (B) | 14 | 3.71 | 0.825 | |
| 3 (M) | 14 | 4.93 | 0.616 | |
| 4 (2RI) | 14 | 5.14 | 0.949 | |
| Total | 57 | 4.81 | 0.990 |
| Groups | Study Subjects(N) | Mean VAS Score for SC | Std. Deviation | p Value of One Way ANOVA |
|---|---|---|---|---|
| Immediate 1 (RI) | 18 | 4.00 | 0.970 | 0.007 |
| 2 (B) | 18 | 3.33 | 0.686 | |
| 3 (M) | 18 | 3.89 | 0.900 | |
| 4 (2RI) | 18 | 4.33 | 0.767 | |
| Total | 72 | 3.89 | 0.897 | |
| 1 Month 1 (RI) | 16 | 4.63 | 0.957 | 0.001 |
| 2 (B) | 14 | 3.64 | 0.842 | |
| 3 (M) | 16 | 4.25 | 0.856 | |
| 4 (2RI) | 15 | 4.87 | 0.640 | |
| Total | 61 | 4.36 | 0.932 | |
| 3 Months 1 (RI) | 15 | 5.13 | 0.915 | 0.000 |
| 2 (B) | 14 | 3.64 | 0.842 | |
| 3 (M) | 14 | 4.93 | 0.917 | |
| 4 (2RI) | 14 | 5.50 | 0.650 | |
| Total | 57 | 4.81 | 1.076 | |
| 6 months 1 (RI) | 15 | 5.27 | 0.799 | 0.000 |
| 2 (B) | 14 | 3.93 | 1.072 | |
| 3 (M) | 14 | 5.29 | 0.726 | |
| 4 (2RI) | 14 | 5.79 | 0.579 | |
| Total | 57 | 5.07 | 1.050 |

Fig. 2: Shows inter-group comparison of mean esthetic improvement (EI) scores over follow-up time intervals at immediate, 1 month, 3 months, and 6 months postoperative.

Fig. 3: Shows inter-group comparison of mean improvement in white/brownish opacities/stains (SC) scores over follow-up time intervals at immediate, 1 month, 3 months, and 6 months postoperative.
Binary comparison between the groups for mean EI (Table 7) and SC (Table 8) using post hoc Tukey's test revealed significantly better results (p < 0.05) for 2RI, RI and microabrasion in comparison to bleaching at 6 months follow-up interval while nonsignificant differences were seen when RI was compared with 2RI or microabrasion.
| Dependentvariable | (I)Group | (J)Group | Mean difference(I-J) | Std. error | p value |
|---|---|---|---|---|---|
| Immediate | 1 | 2 | 0.556 | 0.221 | 0.067 |
| 1 | 3 | -0.111 | 0.221 | 0.958 | |
| 1 | 4 | -0.167 | 0.221 | 0.875 | |
| 2 | 3 | -0.667 | 0.221 | 0.019 | |
| 2 | 4 | -0.722 | 0.221 | 0.009 | |
| 3 | 4 | -0.056 | 0.221 | 0.994 | |
| 1 Month | 1 | 2 | 1.098 | 0.282 | 0.001 |
| 1 | 3 | 0.125 | 0.273 | 0.968 | |
| 1 | 4 | -0.221 | 0.277 | 0.856 | |
| 2 | 3 | -0.973 | 0.282 | 0.006 | |
| 2 | 4 | -1.319 | 0.287 | 0.000 | |
| 3 | 4 | -0.346 | 0.277 | 0.600 | |
| 3 Months | 1 | 2 | 1.505 | 0.273 | 0.000 |
| 1 | 3 | 0.290 | 0.273 | 0.712 | |
| 1 | 4 | 0.005 | 0.273 | 1.0 | |
| 2 | 3 | -1.214 | 0.277 | 0.000 | |
| 2 | 4 | -1.500 | 0.277 | 0.000 | |
| 3 | 4 | -0.286 | 0.277 | 0.732 | |
| 6 Months | 1 | 2 | 1.686 | 0.285 | 0.000 |
| 1 | 3 | 0.471 | 0.285 | 0.357 | |
| 1 | 4 | 0.257 | 0.285 | 0.803 | |
| 2 | 3 | -1.214 | 0.290 | 0.001 | |
| 2 | 4 | -1.429 | 0.290 | 0.000 | |
| 3 | 4 | -0.214 | 0.290 | 0.880 |
| Dependentvariable | (I)Group | (J)Group | Mean difference (I-J) | Std. error | p value |
|---|---|---|---|---|---|
| Immediate | 1 | 2 | 0667 | 0.279 | 0.089 |
| 1 | 3 | 0.111 | 0.279 | 0.979 | |
| 1 | 4 | -0.333 | 0.279 | 0.633 | |
| 2 | 3 | -0.556 | 0.279 | 0.202 | |
| 2 | 4 | -1.000 | 0.279 | 0.004 | |
| 3 | 4 | -0.444 | 0.279 | 0.391 | |
| 1 Month | 1 | 2 | 0.982 | 0.305 | 0.011 |
| 1 | 3 | 0.375 | 0.295 | 0.585 | |
| 1 | 4 | -0.242 | 0.300 | 0.851 | |
| 2 | 3 | -0.607 | 0.305 | 0.205 | |
| 2 | 4 | -1.224 | 0.310 | 0.001 | |
| 3 | 4 | -0.617 | 0.300 | 0.180 | |
| 3 Months | 1 | 2 | 1.490 | 0.312 | 0.000 |
| 1 | 3 | 0.205 | 0.312 | 0.913 | |
| 1 | 4 | -0.367 | 0.312 | 0.645 | |
| 2 | 3 | -1.286 | 0.317 | 0.001 | |
| 2 | 4 | -1.857 | 0.317 | 0.000 | |
| 3 | 4 | -0.571 | 0.317 | 0.285 | |
| 6 Months | 1 | 2 | 1.338 | 0.302 | 0.000 |
| 1 | 3 | -0.019 | 0.302 | 1.000 | |
| 1 | 4 | -0.519 | 0.302 | 0.325 | |
| 2 | 3 | -1.357 | 0.307 | 0.000 | |
| 2 | 4 | -1.857 | 0.307 | 0.000 | |
| 3 | 4 | -0.500 | 0.307 | 0.373 |
Moreover, comparison of frequencies of quality scores between the groups at 6 months follow-up showed that there was a statistically significant difference (p < 0.05) for EI (p = 0.018) (Table 9, Fig. 4) and SC (p = 0.021) (Table 10, Fig. 5) with higher frequency for exceptional improvement in groups 1 and 4, moderate improvement in group 3 followed by 1 and 2 while slight improvement in group 2.
| Study groups | |||||||
|---|---|---|---|---|---|---|---|
| Quality parameter for EI | Group 1 (RI) (N) | Group 2 (B) (N) | Group 3 (M) (N) | Group 4 (2RI) (N) | Total (N) | Chi-square value | p value of Chi-square test |
| No. of dropouts | 3 | 4 | 4 | 4 | 15 | 24.433 | 0.018 |
| Exceptional improvement | 7 | 0 | 2 | 5 | 14 | ||
| Moderate improvement | 8 | 9 | 12 | 9 | 38 | ||
| Slight improvement | 0 | 4 | 0 | 0 | 4 | ||
| No improvement | 0 | 1 | 0 | 0 | 1 | ||
| Total no. of subjects examined | 15 | 14 | 14 | 14 | 57 | ||
| Study Groups | |||||||
|---|---|---|---|---|---|---|---|
| Quality parameter for SC | Group 1 (RI) (N) | Group 2 (B) (N) | Group 3 (M) (N) | Group 4 (2RI) (N) | Total (N) | Chi-square Value | p value of Chi-square test |
| No. of dropouts | 3 | 4 | 4 | 4 | 15 | 23.914 | 0.021 |
| Exceptional improvement | 7 | 1 | 6 | 10 | 24 | ||
| Moderate improvement | 8 | 8 | 8 | 4 | 28 | ||
| Slight improvement | 0 | 4 | 0 | 0 | 4 | ||
| No improvement | 0 | 1 | 0 | 0 | 1 | ||
| Total no. of subjects examined | 15 | 14 | 14 | 14 | 57 | ||

Fig. 4: Shows comparison of frequencies of quality scores between the groups for esthetic improvement at 6 months follow-up.

Fig. 5: Shows comparison of frequencies of quality scores between the groups for improvement in white/brownish opacities/stains (SC) at 6 months follow-up.
Pair-wise comparison using scheffe post hoc test for EI (Table 11) and SC (Table 12) at different pairs of follow-up time intervals showed that there was a statistically significant (p < 0.05) difference between immediate versus 3 months postoperative and immediate versus 6 months postoperative for groups 1, 2 and 4.
| Dependentvariable | (I) Time | (J) Time | Mean difference (I-J) | Std. error | p value |
|---|---|---|---|---|---|
| Group 1 | Immediate | 1 month | -0.701 | 0.252 | 0.062 |
| Immediate | 3 months | -1.322 | 0.256 | 0.000 | |
| Immediate | 6 months | -1.789 | 0.256 | 0.000 | |
| 1 month | 3 months | -0.621 | 0.263 | 0.148 | |
| 1 month | 6 months | -1.088 | 0.263 | 0.002 | |
| 3 months | 6 months | -0.467 | 0.268 | 0.393 | |
| Group 2 | Immediate | 1 month | -0.159 | 0.276 | 0.954 |
| Immediate | 3 months | -0.373 | 0.276 | 0.612 | |
| Immediate | 6 months | -0.659 | 0.276 | 0.140 | |
| 1 month | 3 months | -0.214 | 0.293 | 0.910 | |
| 1 month | 6 months | -0.500 | 0.293 | 0.412 | |
| 3 months | 6 months | -0.286 | 0.293 | 0.813 | |
| Group 3 | Immediate | 1 month | -0.465 | 0.203 | 0.166 |
| Immediate | 3 months | -0.921 | 0.210 | 0.001 | |
| Immediate | 6 months | -1.206 | 0.210 | 0.000 | |
| 1 month | 3 months | -0.455 | 0.216 | 0.229 | |
| 1 month | 6 months | -0.741 | 0.216 | 0.013 | |
| 3 months | 6 months | -.286 | .223 | 0.652 | |
| Group 4 | Immediate | 1 month | -0.756 | 0.284 | 0.080 |
| Immediate | 3 months | -1.151 | 0.289 | 0.003 | |
| Immediate | 6 months | -1.365 | 0.289 | 0.000 | |
| 1 month | 3 months | -0.395 | 00.301 | 0.635 | |
| 1 month | 6 months | -0.610 | 0.301 | 0.263 | |
| 3 months | 6 months | -0.214 | 0.307 | 0.921 |
| Dependentvariable | (I) Time | (J) Time | Mean difference (I-J) | Std. error | p value |
|---|---|---|---|---|---|
| Group 1 | Immediate | 1 month | -0.625 | 0.315 | 0.279 |
| Immediate | 3 months | -1.133 | 0.320 | 0.010 | |
| Immediate | 6 months | -1.267 | 0.320 | 0.003 | |
| 1 month | 3 months | -0.508 | 0.329 | 0.502 | |
| 1 month | 6 months | -0.642 | 0.329 | 0.295 | |
| 3 months | 6 months | -0.133 | 0.335 | 0.984 | |
| Group 2 | Immediate | 1 month | -0.310 | 0.306 | 0.796 |
| Immediate | 3 months | -0.310 | 0.306 | 0.796 | |
| Immediate | 6 months | -0.595 | 0.306 | 0.297 | |
| 1 month | 3 months | 0.000 | 0.325 | 1.000 | |
| 1 month | 6 months | -0.286 | 0.325 | 0.855 | |
| 3 months | 6 months | -0.286 | 0.325 | 0.855 | |
| Group 3 | Immediate | 1 month | -0.361 | 0.294 | 0.683 |
| Immediate | 3 months | -1.040 | 0.305 | 0.014 | |
| Immediate | 6 months | -1.397 | 0.305 | 0.000 | |
| 1 month | 3 months | -0.679 | 0.314 | 0.208 | |
| 1 month | 6 months | -1.036 | 0.314 | 0.018 | |
| 3 months | 6 months | -0.357 | 0.324 | 0.750 | |
| Group 4 | Immediate | 1 month | -0.533 | 0.234 | 0.171 |
| Immediate | 3 months | -1.167 | 0.239 | 0.000 | |
| Immediate | 6 months | -1.452 | 0.239 | 0.000 | |
| 1 month | 3 months | -0.633 | 0.249 | 0.103 | |
| 1 month | 6 months | -0.919 | 0.249 | 0.006 | |
| 3 months | 6 months | -0.286 | 0.253 | 0.736 |
DISCUSSION
In the present study, 6 to 12 year old children with the mean age of 11.36 years were included because the permanent anterior teeth are usually erupted by this period. Dental fluorosis has been reported to be more severe in permanent dentition as compared to deciduous dentition.6 Similar age group was taken by Gugnani et al.,2 Deshpande et al.,7 Doneria et al.,8 and Kumar et al.9 in their clinical studies while evaluating nonpitted dental fluorosis.
Ours is a novel study which evaluates and compares the esthetic improvement and changes in white/brown surface opacities/stains in mild to moderate nonpitted dental fluorosis amongst resin infiltration, in-office bleaching, enamel microabrasion, and resin infiltration with double infiltrant application using minimally interventional treatment modalities, especially resin infiltration, at the follow-up of immediate postoperative, 1 month, 3 months, and 6 months time intervals.
Table 8 shows that there was a statistically significant (p < 0.05)/highly significant difference (p < 0.01) seen for the values between the groups.
-
Immediate between the groups 2 vs 4 (p = 0.004).
-
At 1 month between the groups 1 vs 2 (p = 0.011) and 2 vs 4 (p = 0.001).
-
At 3 months between the groups 1 vs 2 (p = 0.000), 2 vs 3 (p = 0.001) and 2 vs 4 (p = 0.000).
-
At 6 months between the groups 1 vs 2 (p = 0.000), 2 vs 3 (p = 0.000) and 2 vs 4 (p = 0.000).
Subjective evaluation parameters used in our study included scoring for “esthetic improvement (EI)” and “changes in white/brown surface opacities/stains (SC)” on a Visual Analog Scale (VAS) ranging from 1 (No improvement) to 7 (Exceptional improvement) which was adopted from similar studies done by Loguercio et al.10 and Price et al.11 Celik et al. stated that this scale can truly quantify the overall improvement in the appearance of the mottled surface.12
Table 9 shows that there was a statistically significant difference (p < 0.05) seen for the frequencies between the groups at 6 months follow-up with higher frequency for exceptional improvement in groups 1 and 4, moderate improvement in group 3 followed by 1, 2, and 4 while slight improvement in group 2 (p = 0.018).
Table 10 shows that there was a statistically significant difference (p < 0.05) seen for the frequencies between the groups at 6 months follow-up with higher frequency for exceptional improvement for groups 4 and 1, moderate improvement for groups 3, 1 and 2, and slight improvement for group 2 (p = 0.021).
The table 11 shows that there was a statistically significant (p < 0.05) / highly significant difference (p < 0.01) seen for the values of EI between the time intervals.
-
For group 1 between immediate vs 3 months postoperative (p = 0.000), immediate vs 6 months postoperative (p = 0.000) and 1 month vs 6 months postoperative (p = 0.002).
-
For group 3 between immediate vs 3 months postoperative (p = 0.001), immediate vs 6 months postoperative (p = 0.000) and 1 month vs 6 months postoperative (p = 0.013).
-
For group 4 between immediate vs 3 months postoperative (p = 0.003) and immediate vs 6 months postoperative (p = 0.000).
There was a statistically nonsignificant difference (p > 0.05) seen for the values of EI for group 2 between all pairs of time intervals.
Table 12 shows that there was a statistically significant (p < 0.05) / highly significant difference (p < 0.01) seen for the values of SC between the time intervals.
-
For group 1 between immediate vs 3 months postoperative (p = 0.010) and immediate vs 6 months postoperative (p = 0.003).
-
For group 3 between immediate vs 3 months postoperative (p = 0.014), immediate vs 6 months postoperative (p = 0.000) and 1 month vs 6 months postoperative (p = 0.018).
-
For group 4 between immediate vs 3 months postoperative (p = 0.000), immediate vs 6 months postoperative (p = 0.000) and 1 month vs 6 months postoperative (p = 0.006).
There was a statistically nonsignificant difference (p > 0.05) seen for the values of SC for group 2 between all pairs of time intervals.
For Esthetic Improvement (EI)
At immediate postoperative, the results showed the highest mean VAS score in 2RI (3.78) followed by microabrasion (3.72), RI (3.61) and least in bleaching group (3.06) at p value= 0.006. Our findings were supported by a systematic review by Shahroom et al. who reported that resin infiltration with increased infiltration time is amongst the foremost options for treatment of mild to moderate fluorosis stains.13
At 1, 3, and 6 months follow-up, the highest mean VAS score was recorded for RI followed by 2RI, microabrasion and least in bleaching group. These findings were in accordance with those of Gugnani et al. who found that resin infiltration with recommended application strategy or with increased infiltrant application time showed significantly better results than bleaching for change in esthetics.2 The present findings were also supported by Gencer et al. who reported that resin infiltration is more effective than microabrasion in masking fluorosis stains.14 Another study in support was by Giovanni who presented a systematic review from various randomized controlled trials in humans and concluded that resin infiltration seemed to be more effective in management of mild to moderate fluorosis as compared to bleaching and microabrasion.15 Shahroom et al. also stated that resin infiltration showed greater esthetic improvement compared to bleaching.13
In the present study, least mean VAS score values for esthetic improvement were noted for the bleaching group. Bleaching was done with 35% hydrogen peroxide (H2O2). H2O2 in bleaching gel has been reported to produce free radicals which diffuse through enamel and dentin, leading to breaking of the double bonds of pigment molecules which changes the pigment molecule configuration and/or size. Such changes alter the optical properties of tooth structure, creating the perception of a whiter tooth color.16 Our findings were in accordance with Gugnani et al. who reported significantly better results with resin infiltration in comparison to in-office bleaching.2 However, in contrast to the present study, Shahroom et al. in his systematic review stated that microabrasion demonstrates lesser esthetic enhancement as compared to bleaching.13 In a study done by Castro et al., the visual analogue scale (VAS) revealed that subjects treated with in-office bleaching were more pleased with their dental appearance when compared with those treated with microabrasion at 1 month follow-up (p = 0.004).17
For Changes in White/Brown Opacities/Stains (SC)
Statistical analysis revealed a highly significant difference (p < 0.01) between the groups for changes in SC, with the highest mean VAS score values in 2RI group, followed by the resin infiltration group, microabrasion group, and least in the bleaching group at all the follow-up time intervals, that is, immediate postoperative, 1 month, 3 months, and 6 months follow-up. Our findings were in accordance with Castro et al. who noted significant reduction in enamel opacity area (p = 0. 00,001) after treatment with enamel microabrasion at 1 month follow-up.17 Similarly, in the study done by Meireles et al., the patients were treated with microabrasion and followed for 1 month and the statistical analysis revealed significant reduction in stained areas (p ≤0.05).18 Based on the randomized controlled trial done by Gugnani et al., the results revealed that 3-minute increased resin infiltration provided the best treatment approach based on the parameters assessed. Mann-Whitney U test revealed significantly better results for resin infiltration compared with bleaching alone (p < 0.001).2 This was in favour of our study that showed significantly better results for 2RI and RI for both the parameters followed by microabrasion. Least scores were recorded for bleaching group for both the evaluating parameters.
Evaluation of Tooth Sensitivity and Gingival Irritation
In our study, only 2 patients out of 18 reported immediate postoperative tooth sensitivity after the treatment procedure in the microabrasion group which was mild and subsided within 3 to 4 weeks for both the cases without any active dental intervention. None of the patients reported gingival irritation or staining in any of the treatment groups during the course of the study. Our findings were in accordance with those of Bharath et al.19 and Castro et al.17 who recorded only very mild transient tooth sensitivity following either microabrasion or bleaching which subsided a month later.
In the present study, application of GC Tooth mousse (ACP-CPP) was done in two study groups, that is, microabrasion and bleaching at the end of treatment procedures to reduce the chances of postoperative tooth sensitivity. CPP-ACP (casein phosphopeptide-amorphous calcium phosphate) is a remineralizing agent that provides high concentration of Ca++ and PO4 ions which maintains a supersaturated mineral environment, thus helping to reduce demineralization and aid in remineralization of enamel surface.7 The present finding was supported by Doneria et al. who stated that remineralizing agent helps in improving the crystalline structure of enamel and thus reduces the chances of postoperative sensitivity.8
CONCLUSION
-
Fluorosis in India appears to be a social stigmatising factor and has contributed toward suffering and self-exclusion among the pediatric population. The unsightly appearance of teeth due to fluorosis, especially the maxillary anteriors, has social and psychological effects on the quality of life and patients often seek esthetic correction for the same.
-
Our study highlights the effectiveness of recently introduced minimally invasive interventions for the treatment of fluorosis stains. For esthetic improvement (EI) parameter, nearly equivalent clinical success was observed in RI and 2RI groups followed by microabrasion and bleaching when compared at immediate, 1 month, 3 months, and 6 months time frame. For changes in opacities/stains (SC) parameter, the best results were obtained in 2RI treatment group followed by resin infiltration, microabrasion, and bleaching over all the follow-up time intervals.
-
Only 2 participants reported mild postoperative sensitivity immediately after the treatment procedure in microabrasion group that subsided after 2 weeks. None of the patients reported gingival defects or staining in any of the treatment groups.
REFERENCES
1. Ng F, Manton D. Aesthetic management of severely fluorosed incisors in an adolescent female. Aust Dent J 2007;52:243-248. DOI: 10.1111/j.1834-7819.2007.tb00495.x
2. Gugnani N, Pandit IK, Gupta M. et al. Comparative evaluation of esthetic changes in non-pitted fluorosis stains when treated with resin infiltration, in-office bleaching, and combination therapies J Esthet Restor Dent 2017;29:317-324. DOI: 10.1111/jerd.12312
3. Gupta A, Dhingra R, Chaudhuri P. et al. A comparison of various minimally invasive techniques for the removal of dental fluorosis stains in children. J Indian Soc Pedod Prev Dent 2017;35:260-268. DOI: 10.4103/jisppd.jisppd_138_16
4. Russell AL. The differential diagnosis of fluoride and non fluoride enamel opacities. J Public Health Dent 1961;21(04):143-146. DOI: 10.1111/j.1752-7325.1961.tb00373.x
5. Den-Besten P, Li W. Chronic fluoride toxicity: dental fluorosis. Monogr Oral Sci 2011;22:81-96. DOI: 10.1159/000327028
6. Salman FD. Prevalence of dental fluorosis among school children in thammar-yemen population. Rafindain Dent J 2007;7:14-18. DOI: 10.33899/rden.2006.39790
7. Deshpande AN, Joshi NH, Pradhan NR. et al. Microabrasion-remineralization (MAb-Re): an innovative approach for dental fluorosis. J Indian Soc Pedod Prev Dent 2017;35:384-387. DOI: 10.4103/jisppd.jisppd_216_16
8. Doneria D, Keshav K, Singh Chauhan SP. A combination technique of microabrasion and remineralizing agent for treatment of dental fluorosis stains. SRM J Res Dent Sci 2018;9:145-147. DOI: 10.4103/srmjrds.srmjrds_23_18
9. Kumar D, Singh A, Mukherjee CG. et al. Clinical efficacy of hydrochloric acid and phosphoric acid in microabrasion technique for the treatment of different severities of dental fluorosis: An in vivo comparison Endodontology 2019;31:34-39. DOI: 10.4103/endo.endo_142_18
10. Loguercio AD, Correia LD, Zago C. et al. Clinical effectiveness of two microabrasion materials for the removal of enamel fluorosis stains Oper Dent 2007;32(06):531-538. DOI: 10.2341/06-172
11. Price RB, Loney RW, Doyle MG. et al. An evaluation of a technique to remove stains from teeth using microabrasion. J Am Dent Assoc 2003;134(08):1066-1071. DOI: 10.14219/jada.archive.2003.0320
12. Celik EU, Yildiz G, Yazkan B. Clinical evaluation of enamel microabrasion for the aesthetic management of mild-to-severe dental fluorosis. J Esthet Restor Dent 2013;25(06):422-430. DOI: 10.1111/jerd.12052
13. Shahroom NS, Mani G, Ramakrishnan M. Interventions in management of dental fluorosis, an endemic disease: A systematic review. J Family Med Prim Care 2019;8:3108-3113. DOI: 10.4103/jfmpc.jfmpc_648_19
14. Gencer MDG, Kirzioglu Z. A comparison of the effectiveness of resin infiltration and microabrasion treatments applied to developmental enamel defects in color masking. Dent Mater J 2019;38(02):10. DOI: 10.4012/dmj.2018-074
15. Di Giovanni T, Eliades T, Papageorgiou SN. Interventions for dental fluorosis: a systematic review. J Esthet Restor Dent 2018;30(06):502-508. DOI: 10.1111/jerd.12408
16. Li Y, Greenwall L. Safety issues of tooth whitening using peroxide based materials. Br Dent J 2013;215(01):29-34. DOI: 10.1038/sj.bdj.2013.629
17. Castro KS, de Araujo Ferreira AC, Duarte RM. et al. Acceptability, efficacy and safety of two treatment protocols for dental fluorosis: a randomized clinical trial J Dent 2014;42:938-944. DOI: 10.1016/j.jdent.2014.01.011
18. Meireles SS, Goettems ML, Castro KS. et al. Dental fluorosis treatment can improve the individuals OHRQoL? Results from a randomized clinical trial. Braz Dent J 2018;29:109-116. DOI: 10.1590/0103-6440201801733
19. Bharath KP, Subba Reddy VV, Poornima P. et al. Comparison of relative efficacy of two techniques of enamel stain removal on fluorosed teeth. An in vivo study. J Clin Pediatr Dent 2014;38(03):207-213. DOI: 10.17796/jcpd.38.3.0h120nkl8852p568
________________________
© The Author(s). 2022 Open Access This article is distributed under the terms of the Creative Commons Attribution 4.0 International License (https://creativecommons.org/licenses/by-nc/4.0/), which permits unrestricted use, distribution, and non-commercial reproduction in any medium, provided you give appropriate credit to the original author(s) and the source, provide a link to the Creative Commons license, and indicate if changes were made. The Creative Commons Public Domain Dedication waiver (http://creativecommons.org/publicdomain/zero/1.0/) applies to the data made available in this article, unless otherwise stated.